Inspecting the database
This is a reference page for understanding what CHAP stored. It is not a required workshop step.
Two PostgreSQL databases sit behind the stack: chap-core's (models, runs, and the data they used) and DHIS2's (all DHIS2 metadata and data). The APIs are usually the better way in, but raw SQL is handy for digging into a run or answering a question the API does not.
| Database | Service | Host port | DB name | User / password |
|---|---|---|---|---|
| chap-core | chap-postgres |
15433 |
chap_core |
chap / chap |
| DHIS2 | dhis2-db |
15432 |
dhis |
dhis / dhis |
Both are bound to 127.0.0.1 (the bundled stack; ports are overridable with CHAP_DB_PORT /
DHIS2_DB_PORT).
Connecting
A. Into the container (no host tools needed)
Open a psql prompt inside the database container - works even if you have no SQL client
installed:
# chap database
docker compose -f compose.chapkit.yml exec chap-postgres psql -U chap -d chap_core
# DHIS2 database
docker compose -f compose.chapkit.yml exec dhis2-db psql -U dhis -d dhis
If you run CHAP from source, the chap database
service is postgres instead (DHIS2 is unchanged):
At the prompt, \dt lists tables and \q quits. Run a one-off query without the prompt by
adding -c "<sql>".
B. From the host (psql or a GUI)
The databases are published on 127.0.0.1, so a local client can connect directly:
psql -h 127.0.0.1 -p 15433 -U chap chap_core   # chap   (password: chap)
psql -h 127.0.0.1 -p 15432 -U dhis dhis         # DHIS2  (password: dhis)
Or point a GUI such as DBeaver or pgAdmin at host 127.0.0.1 and those ports.
C. pgAdmin (a web GUI)
If you prefer clicking to typing, run pgAdmin - a web UI for Postgres - on the stack's network so it can reach the databases by service name:
docker run -d --name dac-pgadmin --network docker-dhis2-core_default -p 5050:80 \
  -e PGADMIN_DEFAULT_EMAIL=admin@example.com \
  -e PGADMIN_DEFAULT_PASSWORD=admin \
  -e PGADMIN_CONFIG_SERVER_MODE=False \
  dpage/pgadmin4
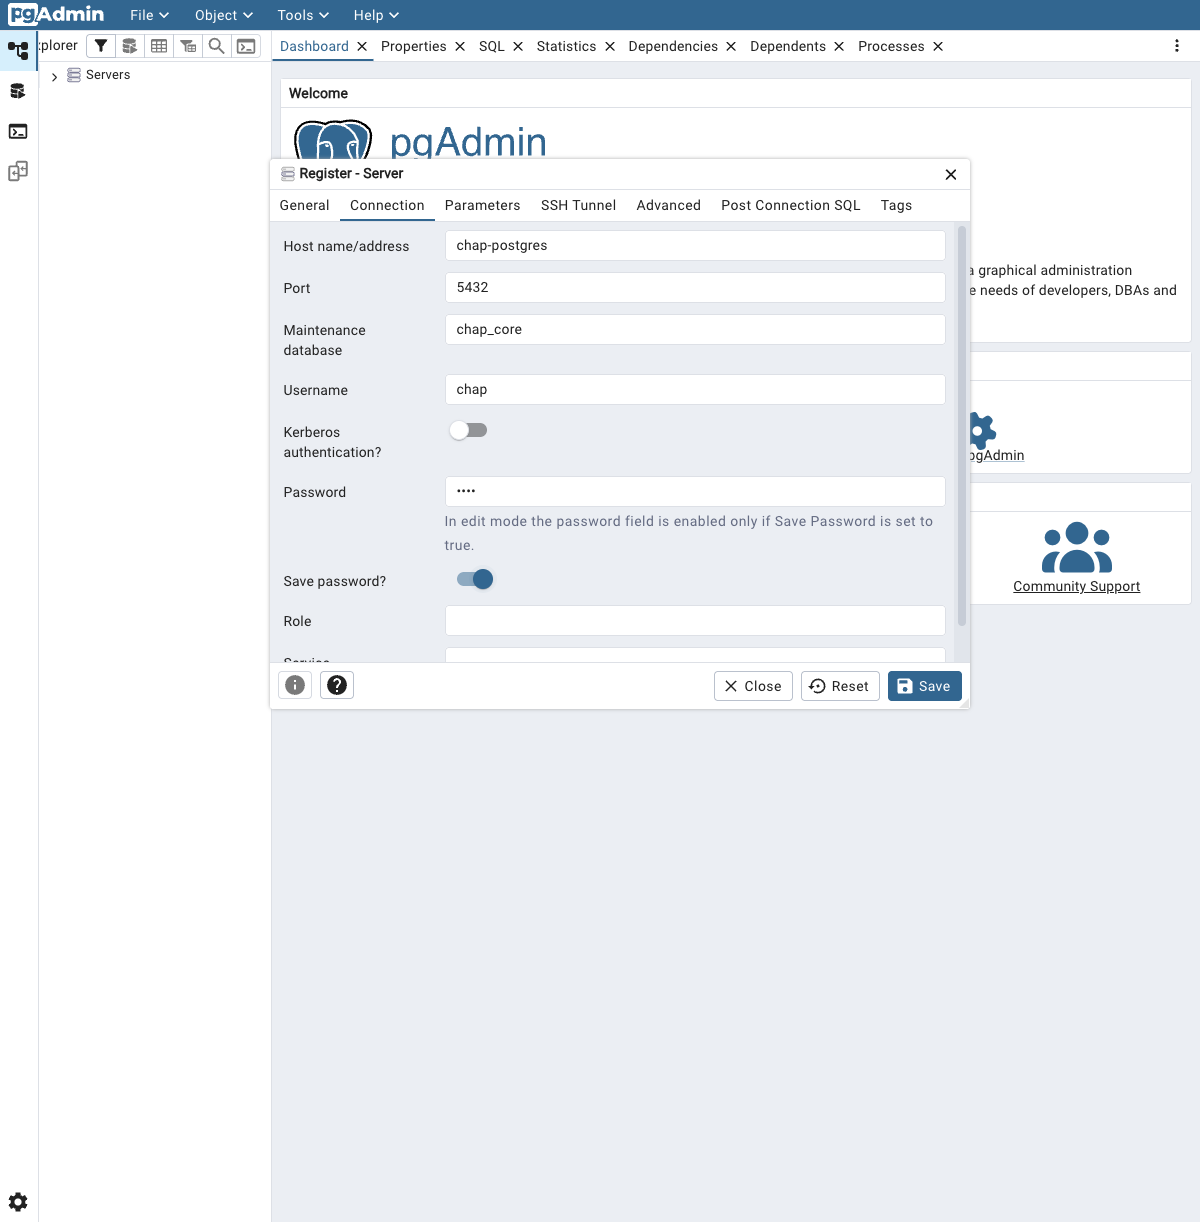
Open http://localhost:5050, set a master password when prompted, then Add New Server. On the Connection tab use the service name as the host (pgAdmin is on the same Docker network):
| Field | chap | DHIS2 |
|---|---|---|
| Host name/address | chap-postgres |
dhis2-db |
| Port | 5432 |
5432 |
| Maintenance database | chap_core |
dhis |
| Username / Password | chap / chap |
dhis / dhis |
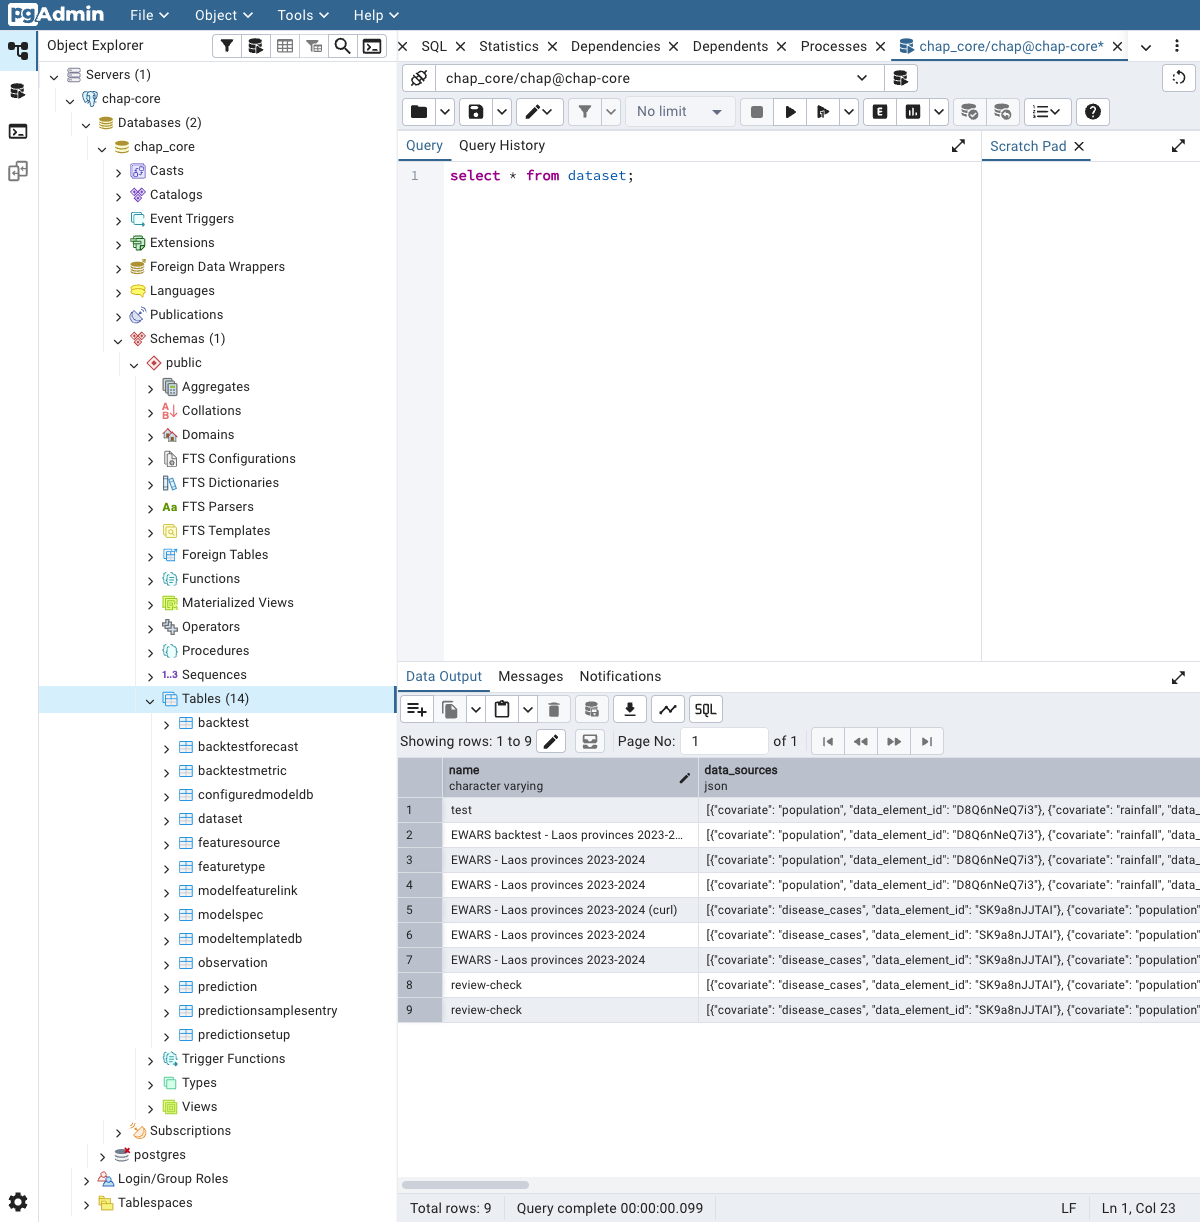
Once connected, open Tools -> Query Tool to run SQL (below), or expand the tree to Databases -> chap_core -> Schemas -> public -> Tables and right-click a table -> View/Edit Data to browse it without writing any SQL.
Stop pgAdmin when you are done with docker rm -f dac-pgadmin.
What's in the chap database
The tables that matter most:
backtest,backtestforecast- evaluations and their predicted valuesprediction,predictionsamplesentry- forecasts and their samplesdataset,observation- the data a run usedconfiguredmodeldb,modeltemplatedb- the models and templates
A few example queries (add them to the exec … -c "…" form, or run them at a psql prompt):
-- the evaluations you have run
select id, name, model_id from backtest order by id;

-- your forecasts and how far ahead they go
select id, name, model_id, n_periods from prediction order by id;

-- how much data is stored, and how many forecast rows
select count(*) from observation;
select count(*) from backtestforecast;

-- the configured models
select id, name from configuredmodeldb order by id;
Most of this is on the chap API too (/v1/crud/backtests, …), so reach for SQL when you need a
join or an aggregate the API does not give you.
What a run writes to the database
Running a model touches a precise set of tables. Measured on the
shared configuration (18 provinces × 24 months, 4 features), each
operation first snapshots its input data (dataset + observation), then writes its own
outputs:
| Table | Rows added | What |
|---|---|---|
dataset |
+1 | the data snapshot this run used |
observation |
+1728 | every input value (4 features × 18 org units × 24 months) |
backtest |
+1 | the evaluation itself - config and aggregate metrics |
backtestforecast |
+378 | the predictions it scored (7 splits × 18 org units × 3 months) |
| Table | Rows added | What |
|---|---|---|
dataset |
+1 | its own data snapshot |
observation |
+1728 | the input values again |
prediction |
+1 | the forecast itself |
predictionsamplesentry |
+54 | the forecast values (18 org units × 3 months) |
backtestmetric stays empty (the metrics live in backtest.aggregate_metrics). A
predictionsetup row is written when you create a prediction setup (the usual path in the
app and the API walkthrough - one per backtest); each forecast run
from it adds the prediction row above with its prediction_setup_id set. A one-off
make-prediction writes the prediction with prediction_setup_id left null.
The affected tables, column by column
dataset - the input snapshot, one row per run:
| Column | Meaning |
|---|---|
id |
primary key |
name |
the run's name |
type |
evaluation or prediction |
period_type |
e.g. month |
first_period / last_period |
the period range covered |
org_units |
JSON array of org-unit ids |
covariates |
JSON array of the model's feature names |
data_sources |
JSON [{covariate, dataElementId}] - which DHIS2 data element backs each feature |
geojson |
the org-unit polygons (a stringified FeatureCollection) |
created |
timestamp |
observation - the input values, many rows per dataset:
| Column | Meaning |
|---|---|
id |
primary key |
dataset_id |
→ dataset |
org_unit / period |
where / when |
feature_name |
which feature (disease_cases, population, rainfall, mean_temperature) |
value |
the number (null where the source had no value) |
backtest - one row per evaluation:
| Column | Meaning |
|---|---|
id |
primary key |
name |
the run's name |
model_id |
the configured model's canonical name |
model_db_id |
→ configuredmodeldb (its numeric id) |
model_template_version |
the template version used |
dataset_id |
→ dataset (the data used) |
org_units |
JSON array of evaluated org units |
split_periods |
JSON array of the backtest cut points (where train/test was split) |
aggregate_metrics |
JSON of the computed metrics (mae, rmse, crps, coverage_*, …) |
created |
timestamp |
backtestforecast - the evaluation's predictions to score, many rows per backtest:
| Column | Meaning |
|---|---|
id |
primary key |
backtest_id |
→ backtest |
org_unit / period |
where / when the prediction is for |
values |
JSON of the predicted quantiles/samples |
last_train_period |
the last period the model trained on (the split) |
last_seen_period |
the last period it had data for |
prediction - one row per forecast:
| Column | Meaning |
|---|---|
id |
primary key |
name |
the run's name |
model_id / model_db_id |
the model used |
dataset_id |
→ dataset |
n_periods |
how many future periods were forecast |
org_units |
JSON array of org units |
prediction_setup_id |
→ predictionsetup if it came from a saved setup, else null |
meta_data |
JSON metadata |
created |
timestamp |
predictionsamplesentry - the forecast values, many rows per prediction:
| Column | Meaning |
|---|---|
id |
primary key |
prediction_id |
→ prediction |
org_unit / period |
where / when |
values |
JSON of the predicted samples for that location and future period |
The DHIS2 database
Same idea on port 15432. DHIS2's schema is large and the API is almost always the better
tool for DHIS2 data - it enforces permissions and returns clean JSON. Use SQL for low-level
checks:
docker compose -f compose.chapkit.yml exec dhis2-db psql -U dhis -d dhis \
  -c "select count(*) from organisationunit;"
Read, don't write
These are the live databases. Inspect freely with SELECTs, but do not hand-edit rows -
changes bypass the application logic and can corrupt a run or your DHIS2 instance. To start
clean instead, recreate the stack: docker compose -f compose.chapkit.yml down -v.
Assignment: look inside chap
- Open a
psqlprompt in the chap database and run\dt. - List your
backtests andcount(*)theobservations.
What's next
Now that you can see the data behind a run, the next step is keeping it safe - Backup and restore covers dumping and restoring these databases.